Data mining and sentiment analysis, which is measuring and interpreting what people are saying about a particular subject on Twitter, is a fascinating thing to do, but be warned you may lose a lot of time once you get started. I know I am finding it to be slightly addictive.
There are so many examples online, but here is my very basic guide which will get you up and running in no time at all.
The four main steps are:
- Anaconda: Install the Anaconda platform.
- Twitter developer: Register yourself as a Twitter developer.
- Install tweepy: Connect from Python to Twitter.
- Hello World!: Experiment.
Let’s dive into more detail:
1. Anaconda
- Go to anaconda.com/distribution and click on the download button to install the latest version.
- Once the .exe file is downloaded, double click on it, and step through the installation process, clicking next when prompted.
The reason we are using Anaconda and not just python from python.org is that Anaconda contains all the packages we want to access (apart from tweepy, which is the one for Twitter). Had we installed just python we would have to go and install each package separately, as python was not originally designed to support mathematical manipulations.
The main ones we will be using to get started, and which we will call using the ‘import’ command at the beginning of each session, are as follows:
- numpy is short for numerical python it contains mathematical functions for manipulating arrays and matrices of numbers.
- pandas is an easy-to-use data structures and data analysis library.
- matplotlib is how plot our data on histograms, bar charts, scatterplots, etc., with just a few lines of code.
We can now practice using the software.
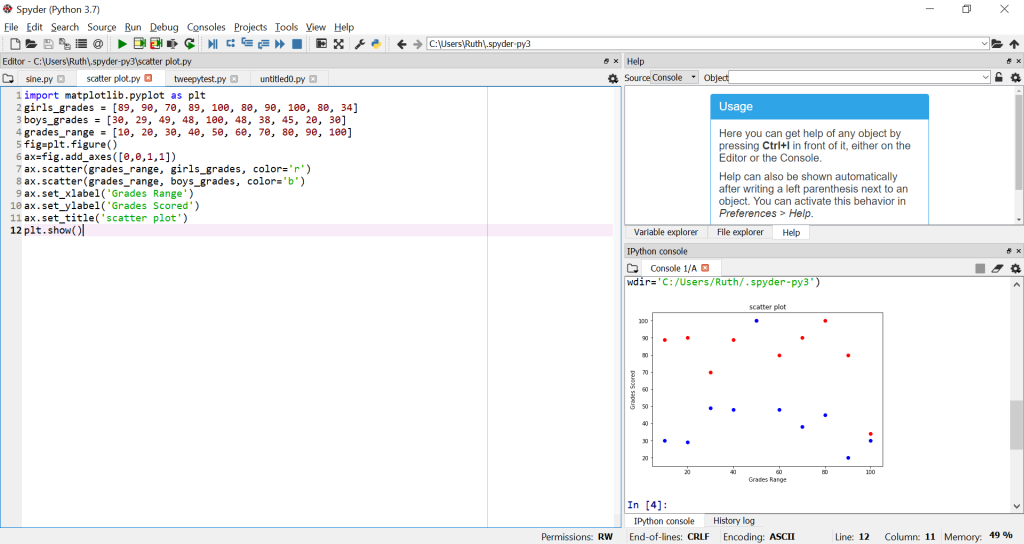
Launch Spyder (Anaconda 3) from the Windows menu. On the left hand side there will be the script editor and on the right hand side is the console. Cut and paste this short script to use matplottib and create a scatterplot of the results. You put it on the left hand side and remove the stuff that is already there, and then you press the run button (it looks like a play button) and you see the results in the bottom right hand side in the console window.
import matplotlib.pyplot as plt
girls_grades = [89, 90, 70, 89, 100, 80, 90, 100, 80, 34]
boys_grades = [30, 29, 49, 48, 100, 48, 38, 45, 20, 30]
grades_range = [10, 20, 30, 40, 50, 60, 70, 80, 90, 100]
fig=plt.figure()
ax=fig.add_axes([0,0,1,1])
ax.scatter(grades_range, girls_grades, color=’r’)
ax.scatter(grades_range, boys_grades, color=’b’)
ax.set_xlabel(‘Grades Range’)
ax.set_ylabel(‘Grades Scored’)
ax.set_title(‘scatter plot’)
plt.show()
You will need to look up some of the commands over on matplotlib and if you don’t know what the commands are doing or indeed why you would want a scatter plot then Google that too. But, already we can see how easy it is to have some data to visualise and how quick it is to do so.

For bigger sets of data instead of declaring them in arrays as we did below:
girls_grades = [89, 90, 70, 89, 100, 80, 90, 100, 80, 34]
boys_grades = [30, 29, 49, 48, 100, 48, 38, 45, 20, 30]
grades_range = [10, 20, 30, 40, 50, 60, 70, 80, 90, 100]
We would put those lines in a file called, for example: all_grades.py and read what we needed like this:
import girl_grades from all_grades.py
So that if we add or delete data we can keep a copy. Make sure you save all your files with useful names you can recognise when you come back to them.
Also make sure that your python PATH is set up correctly. (Google this.)
It is worth following some python online tutorials over on python.org to get a feel for simple python commands and how to read and write from files either in the .py – python format which we used above – or other formats such as csv (often used in Excel) or json (often used in web apps), because we may want to use other people’s datasets or create our own from Twitter and store them in files.
2. Twitter developer
- Log into Twitter, or create an account if you don’t have one.
- Go to the apps section using this link http://apps.twitter.com, and register a new application by clicking on the create an app button.
- There’s a bit of form filling to explain what you want to do:
- I chose hobbyist, exploring the API, and put in my phone no and verified the account using the text they sent me.
- Next page: How will you use the Twitter API or Twitter data? I said that I am using the account for python practice, not sharing it with anyone, but I will be analysing Twitter data to practice manipulating data in real time.
- They send you an email and/or a SMS text with a code. After confirming a couple of times, you will get a Congratulations screen. Ta-daa!!
- Go to the dropdown menu on the top right hand corner and choose the Apps menu, which will take you to the Apps webpage.
- Click the Create an App button. Give your app a name and description e.g. I said: Stalker’s Python Practice, and give a description to the Twitter team about how you will just be using this app for practice. (You won’t need Callbacks or enable Twitter Sign-in.) Click Create at the bottom.
- The page which appears is your Apps page. Go to Keys and Permission and you will see your Consumer API keys which are called consumer key and consumer secret. These keys should always be kept private otherwise people will be able to pull your data from your account and your account will become compromised and potentially suspended. Underneath them it says Access token & access token secret, so click Create, and you will receive you an access token and an access token secret. Similarly to the consumer keys, this information must also be kept private .
Stay logged into Twitter but now we move onto Anaconda.
3. Install Tweepy
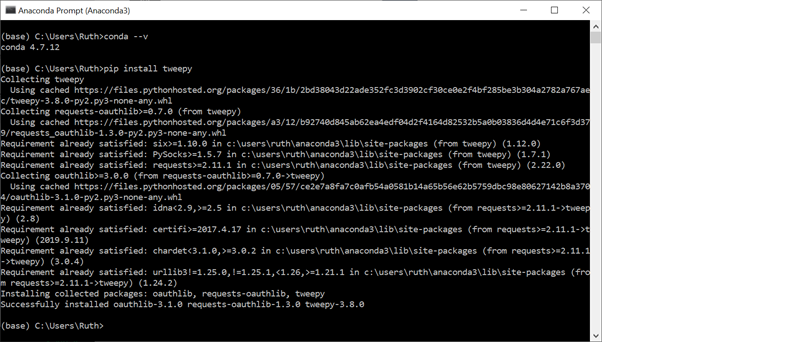
Launch the Anaconda Prompt (Anaconda 3) which you will find in the menu on Windows and then type: pip install tweepy

Theoretically we could do everything in this console but the Spyder set up makes it so much easier. Close this console and we are now ready to begin!
4. Hello World!
Cut and paste this script into the left hand side and replace each xxxxxxxxx with your consumer_key, consumer_secret, access_token, and access_secret, but leaving the quote marks around them:
import tweepy
from tweepy import OAuthHandler
consumer_key = ‘xxxxxxxxxxxxxxxxx’
consumer_secret = ‘xxxxxxxxxxxxxxxxxxxxxxxxxxxxxx’
access_token = ‘xxxxxxxxxxxxxxxxxxxxxxxxxxxxxxxxxxxxxxxxx’
access_secret= ‘xxxxxxxxxxxxxxxxxxxxxxxxxxxxxxxxxxxxxxxxxxxxxxx’
auth = OAuthHandler(consumer_key, consumer_secret)
auth.set_access_token(access_token, access_secret)
api = tweepy.API(auth)
for status in tweepy.Cursor(api.home_timeline).items(10):
# Process a single status
print(status.text)
The top section of code will give you access to Twitter and the last three lines will print out 10 of the latest status tweets which normally appear in your home timeline.
Again save this script in a file so that you can reuse it.
And there you have it.
Next steps
Now you are set up, you are ready to begin manipulating the data you read from Twitter and here are three tutorials of varying complexity:
- Mining Twitter Data by Marco Bonzanini. This is a nice tutorial using json, a different file format which both Twitter and python recognise.
- Extracting Twitter Data, Pre-Processing and Sentiment Analysis using Python 3.0 by Dilan Jayasekara. This tutorial here will demonstrate how to interpret and use emojis from your Twitter data.
- Twitter Sentiment Analysis Using TF-IDF Approach by Usman Malik. This is a more complex one using the pandas library and the python scypy scikits which explores the statistical analysis technique some search engines use to weigh the words in a text files so that it can rank pages in terms of relevance to your query.
You may want to use datasets from Kaggle.com or perhaps ones which are geolocated such as the ones at www.followthehashtag.com or Github, or from Twitter itself. There really is a world of data out there.
And, as part of the Anaconda framework there is the Jupyter notebook which can create webpages on the fly so that you can share your findings really easily. And then there is Tensorflow which is can be used for machine learning in particular neural nets because it contains all sorts of statistical techniques to help you manipulate data in a super powerful way and yet straightforward way.
The possibilities with Anaconda really are endless.
Troubleshooting
I am writing this tutorial as timestamped and running it on Windows 10. All the apps I mention are updated frequently, so these instructions may not represent what you have to do in the future. You may need to explore, but don’t worry, you won’t break anything. The worst case scenario is that you delete what you have done and start again which is always great practice.
If you get an error message, check you cut and paste the whole script correctly, and that your PATH is pointing in the right diection. If that doesn’t help, read the message carefully and see what it says. If you still don’t know, cut and paste the message into Google, someone somewhere will have found the solution to the problem.
This is the gift of the World Wide Web, someone somewhere can always help you, you can find whatever you are looking for, and someone is always creating something new and amazing to use. It really is magic.
Good luck and happy hunting.


3 comments